
Engineering
Building a local code graph for people and coding agents
How Graphtia builds a local, source-backed code graph: symbol resolution, cross-language boundaries, APIs, declared databases, bounded agent queries, and the measurements and failed experiments shaping its next improvements.
On this page
Finding a function in an unfamiliar repository is usually the easy part. Understanding why it exists takes longer. I need to find its callers, work out where its dependencies come from, and follow the effect of a change into files I have not read yet. Much of that work happens in my head while I move between search results and source code.
That becomes harder when a coding agent helps with the investigation. An answer can sound plausible while leaving out a relationship that would change the conclusion. I wanted a way to follow those claims back to the code and see what had actually been established.
That need led me to build Graphtia Explorer. It keeps a semantic graph of a local codebase so a person or an agent can continue an investigation without reconstructing the same connections every time. The useful part is the movement between a symbol, its relationships, and the source behind them. A small example from Graphtia's own storage code makes this more concrete.
Starting with ReverseBlock
In crates/atlasgraph-storage/src/lib.rs, ReverseBlock is a private Rust type used for incoming-edge lookup. Its declaration is small:
struct ReverseBlock {
    storage_class: StorageClass,
    schema_version: String,
    partition_id: u32,
    block_id: u64,
    by_target: BTreeMap<String, Vec<ReverseEdgeReference>>,
}
The interesting field is by_target. It groups reverse-edge references by target; each reference holds an edge ID and a source URI. Reading that declaration gives me a starting question: what reads one of these blocks, and how does that reader fit into a query?
For this article, we checked that path against the indexed repository and the original source. The first neighborhood request hit its time budget. Rather than treating the partial view as the whole answer, we switched to the type's references. That focused result returned six confirmed static TYPE_USES relationships.
One led to AtlasStorage::load_reverse_block_with_peak. At line 3884, the type is the generic argument to the block decoder. Selecting the method gives the next question a precise target. A one-hop callers query returned a confirmed call from load_admitted_reverse_block, with the call's source at line 3873.
Now the investigation has moved from a type declaration to a particular read path. I can inspect the decoder and check how the surrounding method validates the block. If I need the construction side instead, the indexed writer has a separate INSTANTIATES relationship to ReverseBlock. Type use, construction, and invocation are different facts, so the graph keeps them different.
The limits were useful here too. A further link from prepare_reverse_block to load_admitted_reverse_block remained UNRESOLVED. The expression is visible in the source, but this Rust analysis did not promote its receiver target. Opening the code lets us examine that gap without changing the graph's evidence label.
Keeping the investigation small
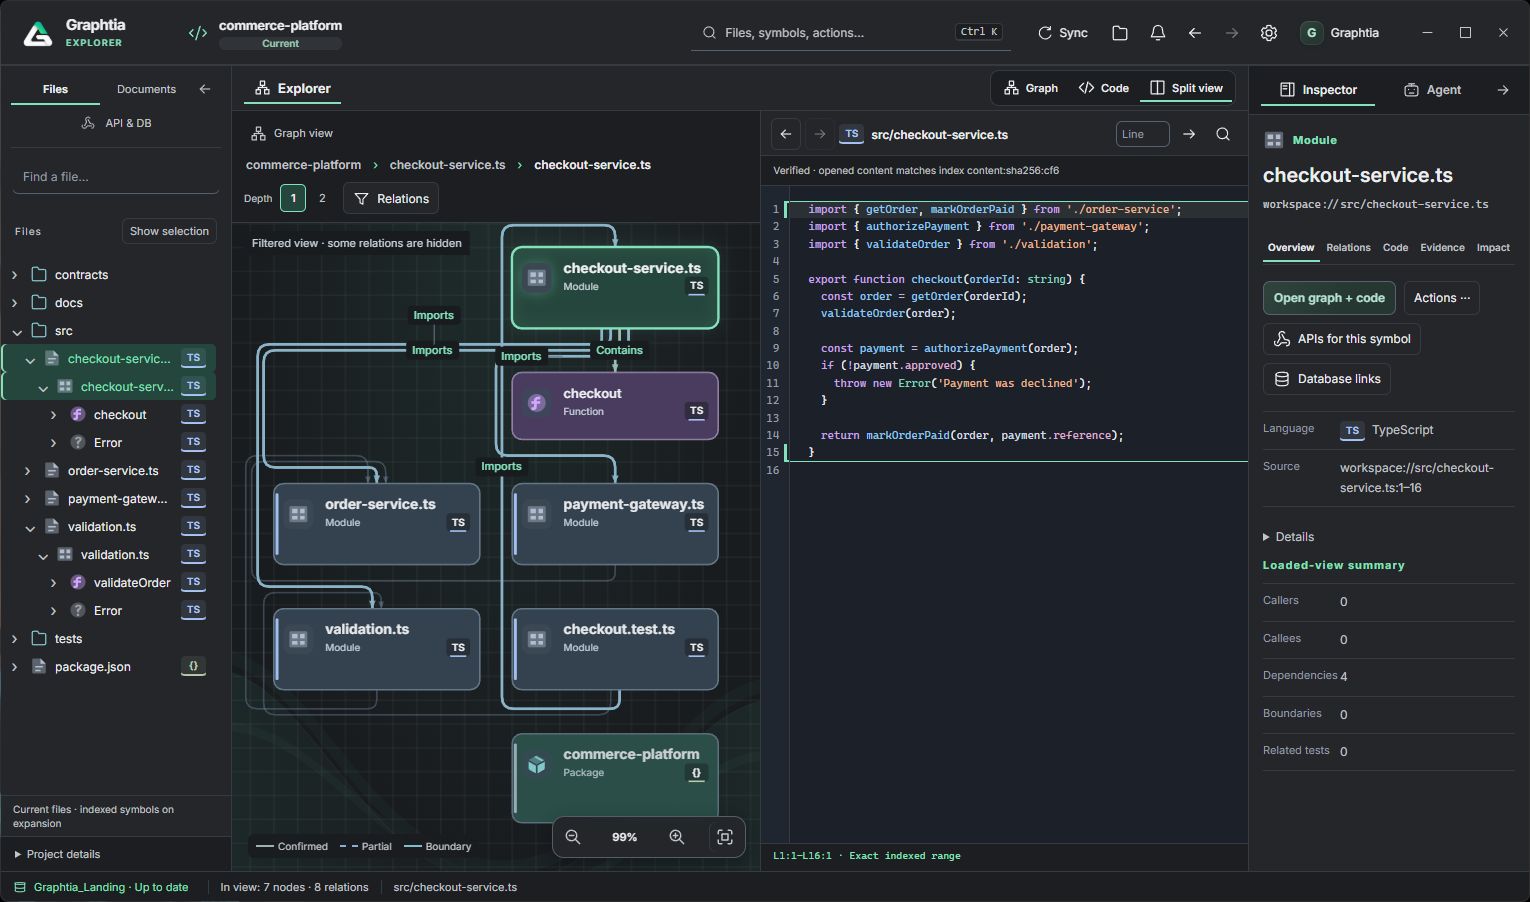
The visual workflow follows the same rhythm: select something small, examine the relationships around it, then inspect the source that makes one of those relationships interesting. The next useful step might be an incoming use or an outgoing dependency. It depends on the question.
Explorer keeps the graph and source view together so moving to that neighboring entity does not require starting the investigation again. I can follow a relationship into the code, use what I read there to choose the next entity, and continue in either direction.
A picture containing thousands of nodes would make that harder. The visualizer uses bounded projections of a pinned revision and performs layout in a worker. The editor remains where I write and run code; this view helps me decide which part of the system I need to understand next.
Example and method: the real split-view image accompanying this section shows a separate TypeScript example. It illustrates the interface, not the ReverseBlock query above. That investigation used focused MCP queries and source inspection, not a runtime trace or a recording of native UI clicks. The reference and caller queries completed for the requested indexed scope. The first neighborhood remains partial.
What has to survive a navigation step
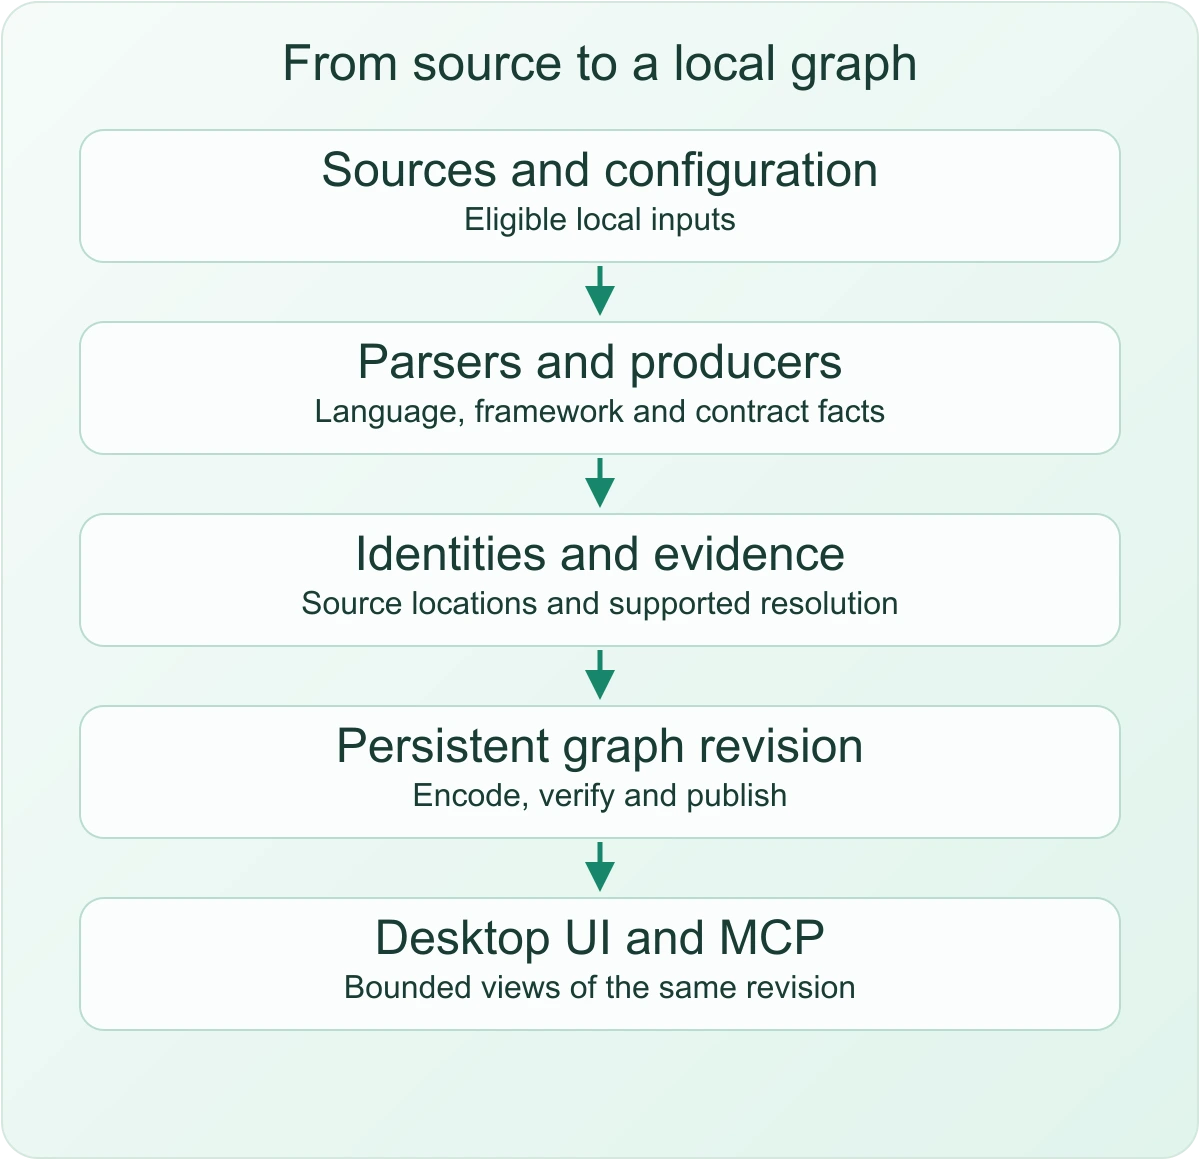
To make that navigation dependable, the graph needs to retain more than names. A declaration and a reference must have identities that survive being stored and queried later. Their source locations must still explain why an edge exists.
The engine discovers eligible inputs, then asks the appropriate producers for facts. It resolves the relationships those facts support and publishes a persistent graph revision. Both the desktop and MCP clients investigate that revision. Building the index does not require an AI model.
Different inputs need different treatment. A declared SQL table is not a deployed database. A project document should not inflate the code LOC count. Keeping those corpora separate is also why the measurements below distinguish physical input files from analyzed entries.
Documents have explicit bounds: admission is limited to 256 KiB, while search covers metadata and a 4 KiB text prefix. Reading a selected document is a separate operation. A search miss cannot rule out a phrase in a later passage.
Parsing is not the same as resolving a variable
The ReverseBlock example also exposes a distinction that matters throughout the system: recognizing a name is easier than resolving what a use means.
Graphtia builds on established language technology. JavaScript and TypeScript use Oxc for parsing and semantic scopes, with module resolution. Rust uses syn. Six other syntax frontends use Tree-sitter; the language matrix lists their individual coverage. The C# path uses a separate Roslyn analyzer, while C/C++ and prepared Arduino analysis use an isolated libclang package.
Those are dependencies, not proprietary Graphtia parsers. Our work starts in adapting their results into a common model and deciding which relationships the available context can support. Adapter contracts and reproducibility locks keep that context explicit.
Consider a local variable named db. Its spelling does not establish a database connection. The analyzer has to bind the use to its declaration and respect shadowing. If that declaration is an imported alias, resolution may need to cross a module boundary before the receiver's origin becomes clear.
For TS/JS, supported imports and re-exports retain their identities across files. Static CommonJS forms have their own handling. A resolved binding can support a reference or call without establishing the value that will exist at runtime. Full TypeScript type checking is outside this analyzer.
For SQL, the receiver's origin matters. One inspected regression fixture follows a recognized PostgreSQL factory through an awaited handle into a transaction callback. The callback's receiver supports a tagged SQL site. For an exported helper, that evidence applies only in proven invocation contexts; it is not a connection proof for every call to the helper.
That fixture supplies accepted import facts at an adapter boundary. It does not test the entire module resolver, and it contains no DDL with which to bind a table. We inspected its source for this article rather than claiming a fresh execution of it.
Reassignment or an opaque escape can withdraw receiver provenance. Dynamic dispatch and reflection have other gaps. Each adapter has to expose its limits instead of allowing a matching name to stand in for a resolved target.
Cross-language relationships need an explicit boundary
The next problem appears when the path leaves one language. A TypeScript consumer and a Rust function can participate in the same application without sharing an ordinary language-local call edge.
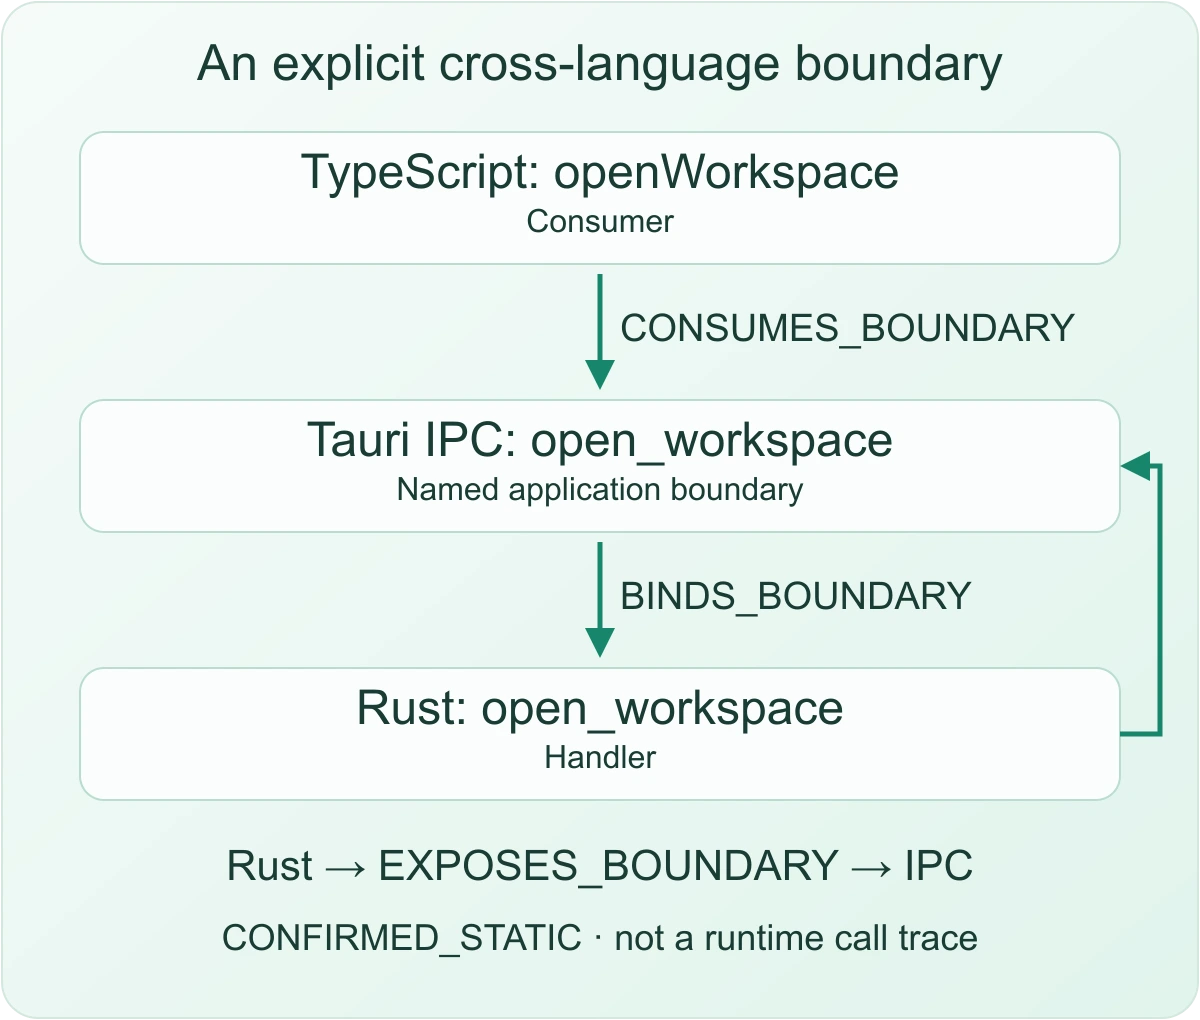
Our controlled Tauri example uses a named IPC boundary between them. Its verified one-hop neighborhood contains three nodes and three directed relationships:
The TypeScript consumer
CONSUMES_BOUNDARYthe IPC boundary.The boundary
BINDS_BOUNDARYthe Rust handler.The Rust handler
EXPOSES_BOUNDARYthat same boundary.
All three were CONFIRMED_STATIC in this fixture. They establish the supported static connection, not execution or a direct TypeScript-to-Rust CALLS edge.
The same boundary model can represent supported HTTP and gRPC patterns. Asynchronous-task relationships have a separate producer, currently based on supported Celery patterns. Each family needs its own recognition rules and compatible application scope.
That leaves substantial gaps. Arbitrary FFI is not covered by this example, nor is cross-language type checking. The cross-language documentation describes the supported boundaries; it does not promise automatic federation between unrelated workspaces.
Connecting APIs, handlers, functions, and declared tables
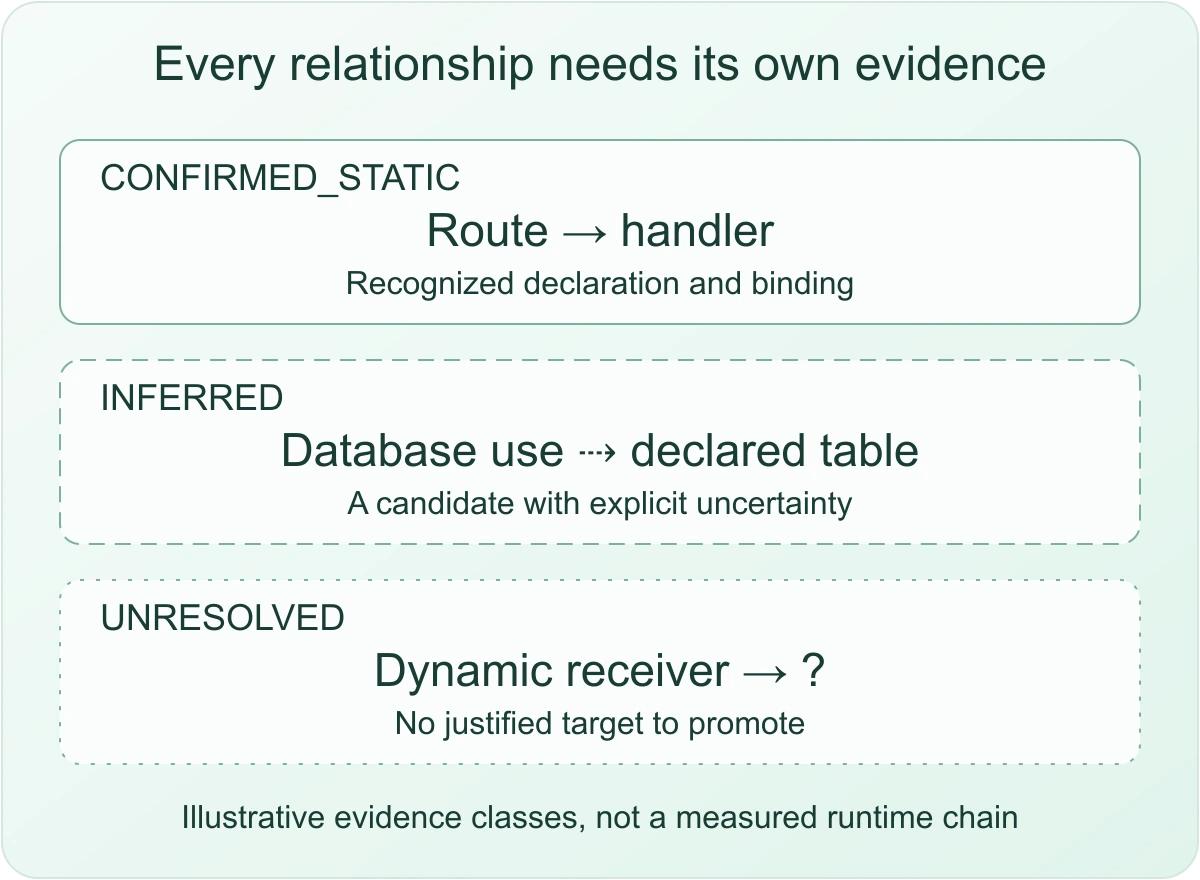
Database investigation made the evidence problem especially visible. A route can bind to a handler, and the handler can call a function containing SQL. Even when both facts are clear, they do not establish which production database the operation reaches.
The handler binding also differs from ownership: the API declaration's owner can be its containing module. Keeping those relationships separate prevents a convenient diagram from quietly changing their meaning.
OpenAPI adds declared contract evidence. Supported 3.0/3.1 JSON/YAML inputs can expose nested schema details and local references within bounded analysis. External references are not fetched. The contract does not establish that an endpoint was deployed or that the implementation conforms to it.
For SQL, the schema parser first needs a declaration to relate to. It handles bounded PostgreSQL, SQLite, and MySQL DDL. Supported CHECK expressions are analyzed structurally, but a function call inside a CHECK can leave it partial. PostgreSQL routine and trigger headers have bounded support; their bodies can remain opaque.
The code-side producer then needs a supported query site and enough receiver provenance. The TS/JS patterns include the PostgreSQL drivers postgres and pg; supported SQLite and MySQL driver patterns have their own paths. Python's Django/SQLAlchemy evidence has separate requirements. The database-code matrix records the exact drivers and gaps, including why the presence of an ORM does not imply general query-builder expansion.
A broad query during review remained unresolved, while a properly scoped query produced an inferred table link. Both observations were real. The scoped link did not prove a live connection, and the broad result did not prove that table resolution was impossible.
For this article, a current fixture gave us an API → handler → function chain and a separate SQL declaration. There was no SQL in that handler. We left the pieces separate rather than joining them by a shared table-like name.
The documented order-flow example shows the layers together in an archived native view. Its GET handler reaches readOrders and readCustomers; SELECT sites sit beside declared tables. The screenshot retains Partial and Inferred indicators. It is a useful combined view precisely because the possible table matches are still qualified, not because a request or query was executed.
For migration planning, bounded comparisons can inspect supplied DDL and supported ordered declaration composition. A supplied snapshot is not automatically a verified live schema. Typed-sample CHECK evaluation preserves SQL NULL semantics; it does not execute a migration or certify row validity.
The API guide, schema guide, and code-to-table contract retain the detailed coverage. SQL Server/T-SQL, Oracle PL/SQL, and MongoDB are not extra declared-schema dialects in this matrix.
Support has several dimensions
Adding an adapter did not make every language equally understood. The current inventory groups ten ecosystems, with 23 framework-category adapters and four boundary families. Two of those framework-category adapters produce DB-code evidence. React/Next share one adapter, so these counts should not be read as an interchangeable list of framework brands.
Build context can be decisive. Prepared C++ and Arduino analysis needs explicit compilation and header context, with source mapping for prepared generated code. Recognizing a sketch's extension is not enough to understand an arbitrary board configuration.
Framework extraction has a similar boundary. Recognizing an ASP.NET route or a Spring declaration does not execute its container. Related-test recognition does not run the test; a confirmed association and an inferred candidate remain different results.
The full compatibility tables belong in the language matrix and framework guide. Unsupported languages and dynamic patterns are documented there rather than turned into graph relationships by inference.
Further reading by ecosystem: web/PHP · Go · Java · .NET · Python.
Keeping the view honest after a file changes
Once a useful path is visible, another question follows: what happens after a file changes?
The graph is persistent, so a new investigation does not have to reconstruct every fact from scratch. Incremental indexing maintains it after source changes. File observation supplies change evidence, but it cannot always establish that nothing changed. Startup reconciliation and missed events can still require source verification; build-context changes matter too.
We encountered this distinction with Linux observer exhaustion. An unavailable observer is not evidence that the source is current. The state needs to remain visible while the application recovers or verifies it another way.
Persistence adds a second constraint. A new revision must be safe to publish, and an interrupted publication must be recoverable. The storage layer uses independently checksummed Zstandard blocks and a durable journal. Compact evidence dictionaries reduce repeated representation, while decoded-size adaptive partitions keep a block's in-memory shape relevant to admission.
The reverse index used by incoming-edge queries is reconstructed with a disk spool—the storage side of the ReverseBlock example. Query locality routes reads to relevant blocks, and a query-scoped decoded cache is bounded by bytes. The index on disk, the query's working set, and the visible projection do not need to be the same size.
That architecture makes a local graph practical, but it also creates work at publication time. The measurements below show why we are still examining that cost.
Giving agents the same investigation context
A coding agent needs to make the same choice a person does in the visualizer: which relationship is worth following next?
For ReverseBlock, references were useful before callers, because the first target was a type. get_callers becomes appropriate after selecting a method. get_dependents answers a different question about incoming imports/dependencies; a function can have callers without import-level dependents. Making that choice explicit avoids interpreting every empty collection as a missing feature.
For investigation, output_format: DIGEST compacts both text and structured content. The returned identities let the agent request deeper evidence rather than reload broad context. JSON provides a fuller representation. RECORDS/JSONL support exact paginated export of the retained result; the older presentation: DIGEST option changes the text preview only.
The first ReverseBlock neighborhood is also a useful example of budget recovery. It stopped at a limit, so we asked a narrower question. A smaller representation would not have repaired that traversal. Other operations may need more node or edge budget, a supported recovery query, or another source inspection.
An export cursor does not remove an analyzer gap, and the tools do not all share one continuation contract. The MCP reference and result-limit guide describe what each operation actually promises. An incomplete result stays incomplete even when its digest is easy to read.
Access, activity, and concurrent agents
Sharing that workspace context with more than one client made access control part of the design. A client identifying itself is not permission to read a project. The user chooses workspace access, either temporarily or indefinitely within the relevant client/workspace context.
We tested three MCP connections in parallel. That is a concrete multi-client result, not three simultaneous full-index rebuilds or an unlimited-throughput claim. The Agent view records Graphtia operations so the user can inspect what a client queried; it is not a transcript of private reasoning or unrelated shell commands.
Local analysis also needs a precise privacy description. Account authentication and installation registration communicate with Cloud, as do product policies and updates. Operational telemetry is limited to bounded measurements and event codes. Its contract rejects raw source, graph payloads and paths. Raw logs and tokens are excluded too. Users can disable it. A voluntary support description is separate free text.
That is a contract inspection, not a packet capture of every transport. An external coding agent can send the context it receives to its own model provider. Running the index locally does not make the entire surrounding workflow air-gapped.
What ERM does—and what it cannot promise
The memory problem begins before the graph reaches the screen. Parsing and storing facts requires temporary objects, and concurrent work can keep several of those objects alive at once.
ERM, the Elastic Resource Manager, admits and accounts for indexing work against the resources available to the engine. Ownership and release rules matter as much as the initial budget. A path that retains optional state can make a later allocation fail even if that state was meant to save work.
Some minimum reservations are indivisible. Refusing one can be the correct outcome when the safe minimum is unavailable; we do not claim that every request already negotiates a smaller allocation. ERM cannot make an arbitrary repository fit any machine.
The measurements need the same care. Accounted objects are not resident memory, and available physical RAM is not the same as system commit. A worker ceiling is a policy, not evidence of useful parallel work. Those distinctions became more important when we moved from a modest desktop to a much larger server.
A modest desktop result we can actually describe
One historical Ubuntu full rebuild in Fast mode took 11 minutes 26.343 seconds. The associated catalog reports 2,157,061 code LOC, 5,604 code files, 2,268 documents, and 18 contracts. The run analyzed 7,890 entries without reusing analysis. The preserved development corpus is called nochange68; this is not a claim that the current application's unique hand-written source is that large.
The host was an Intel Core i7-8550U with eight logical processors and approximately 8 GB RAM. The measurement was recorded on November 1, 2026. Its elapsed time includes saving and integrity verification; queue time and export are excluded.
That is one observed historical rebuild, not a cold-run median, a process-memory measurement, or a prediction for every project. We do not have a contemporaneous per-run hardware/peak-memory capture for that execution. The corpus contains duplicated and other non-unique material; code LOC measures analyzed code volume, not unique hand-written application logic.
The catalog's 770,735 symbols and 2,373,825 code relationships are separate statistics. They are not a measured total of every node across code, documents, and contracts. The historical phase receipt and preserved catalog have compatible counts, but the receipt does not contain a graph-revision hash that proves their exact graph identity.
That is still a useful result: a multi-million-code-line corpus was analyzed on a modest desktop. It does not need a server-sized RAM claim to be interesting.
Why a larger server did not settle the performance question
We subsequently ran warm full-rebuild series on the same binary and a frozen input inventory: 11,657 physical files / 181,283,974 input bytes. Physical input files are not the same count as admitted/indexed entries. Three accepted rebuilds per server gave these medians:
Host | Configuration | Median full rebuild | Scope |
|---|---|---|---|
Server A | 8 vCPU, 32 GB RAM | 559.931 s | Three warm Native FULL/FAST rebuilds |
Server B | 24 cores / 48 threads, 384 GB RAM | 372.454 s | Three warm Native FULL/FAST rebuilds |
The observed elapsed-time reduction between those hosts was about 33.48%. CPU, RAM, storage, and other host conditions differ, so this is not an isolated RAM-scaling experiment. The historical 8 GB run is a separate measurement from an earlier build/input history, not another point on a controlled scaling curve.
The input corpus has not been published as an independently reproducible public benchmark. We can inspect our preserved inventories and receipts; readers cannot independently reproduce the whole series from this article alone. Counts and methodology are useful evidence, but they are not a substitute for public inputs and a reproducible harness.
The more useful finding was inside the larger server's profile. The Native indexing process, excluding its child processes, averaged roughly 1.26 CPU cores despite a much larger available machine. Requested worker width was not the same as observed useful parallelism.
Memory sampling also argues against equating installed RAM with product demand. Across the three large-server rebuilds, the largest sampled Native PSS per run ranged from 5.35 to 5.55 GB; the selected product processes including UI and children ranged from 5.88 to 6.09 GB. At sixty seconds after completion, those ranges were 1.43–1.56 GB and 1.96–2.08 GB, respectively. These are decimal GB from PSS samples roughly two seconds apart, not exact kernel high-water marks, ERM reservations, or an 8 GB desktop peak. The running desktop and its caches do not return to zero memory.
Median persistence occupied about 107.637 seconds, or 28.90% of the larger server's total. Integrity verification was another 44.983 seconds. Those labels cover work such as preparing representations, encoding, compression, checking, writing, and publication. They do not establish that physical disk bandwidth or fsync alone caused the delay.
On the historical desktop run, saving and integrity together were about 40.75% of elapsed time. Calling all of that “disk time” would hide the distinction we need to optimize.
The changes under test
The profiles pointed to repeated work before they justified a new storage design.
During compact block preparation, the original path could revisit an evidence dictionary after its inventory had already been built. We added an optional numeric representation to avoid those repeated lookups when it fits the original memory envelope. Highly shared evidence can favor the keyed representation, so that fallback remains.
We also found repeated measurements of already admitted immutable graph objects. Reusing a measurement is only valid under the same ownership guarantee. It cannot become permission to skip integrity checks.
Cross-file resolution had a related issue: global context should be prepared once rather than reconstructed for each import. The candidate freezes that context and accepts results deterministically. Source-derived scope metadata can be reused when it is still valid; fact-dependent state is recomputed.
To find out whether those changes use the machine better, we added observations of actual dispatched work and active workers. Summed task durations must stay separate from wall time. Otherwise, more instrumentation could make parallel work look more expensive simply by counting overlapping intervals twice.
The constraints remain the same. We preserve evidence and relationship multiplicity through encoding and publication. The new path still needs its checksums and physical verification. We have not substituted an unbounded RAM buffer for the final save, or demonstrated that saving after each phase removes the cost.
The optimized preparation microbenchmark is separate from a full index. It alternates twelve paired measurements for each of three synthetic evidence patterns, with 72 measured records plus warmups. The primary receipt was recovered and independently matched to its SHA-256 before inclusion here.
Evidence pattern | Keyed preparation median | Numeric option allowed: median | Median paired improvement |
|---|---|---|---|
Unique | 7.213 ms | 5.3965 ms | 24.10% |
Highly shared | 2.6855 ms | 2.7645 ms | 0.45%; no clear improvement |
Mixed | 5.6285 ms | 3.969 ms | 29.20% |
This used an optimized build and asserted exact serialized-byte equality and zero current accounted bytes after all 78 runs including warmups. Accounted peaks were unchanged for each pair of paths. Allowing the numeric option does not mean it was selected: highly shared evidence can retain the keyed fallback.
The ratio of two medians and the median of paired ratios are different statistics. In the shared case, the former is about 2.94% slower while the latter is almost unchanged, with pairs in both directions. We do not call that case a speedup. None of this is an end-to-end indexing improvement; the full-corpus comparison is still pending.
Failures that changed the investigation
One early optional optimization made a minimum-memory test fail. It was a useful failure: reducing repeated work was not enough if retaining the optimization raised the minimum needed for a valid analysis. We revised that path and kept the exact-floor regression.
Other checks changed the investigation in similar ways:
Observation | What it taught us | Current disposition |
|---|---|---|
A new optional optimization failed an exact minimum-memory test. | Optional state must not raise the minimum needed for a valid analysis. | The path was revised; focused regression gates passed on their recorded source revisions. |
A test injected logical memory pressure without forcing a real host allocation. | A test can pass or fail for the wrong resource event. | The fixture was corrected to exercise an actual SDK reservation before emission. |
A benchmark baseline reused a compiled storage component although the intended source differed. | A successful compile is not enough to establish a fair A/B. | That attempt was rejected. Clean baseline and candidate executables were subsequently validated; the full-corpus comparison remains unfinished. |
Windows compilation stopped at the system commit reserve. | Available physical RAM is not the same as available commit headroom. | The run is recorded as interrupted before tests, not a functional test failure or a pass. |
A local secure-store failure produced a sign-in error. | A pre-transmission storage problem must be distinguished from a consumed refresh token or actual revocation. | A bounded client correction is reviewed; 94 account-worker regressions passed on Windows. Linux and installed acceptance remain pending. |
Some broad graph and SQL requests returned incomplete results. | Discovery scope, evidence strength, transport limits, and semantic resolution are distinct. | Recovery and guidance improved; unresolved and bounded cases remain explicit. |
An earlier complete Windows storage suite passed 401 tests, with three explicit ignored measurements. Other functional gates cover graph encoding, verification, source-scope reuse, publication receipts, and history. These are pinned component-level checks, not a single universal certification and not additional indexing benchmarks.
A later local Core measurement ended under host-wide memory pressure without a usable final report. The system closed a ChatGPT process, and the supervisor had recorded lost headroom without stopping the workload. We rejected the run and are correcting that supervision before repeating it. It provides no accepted performance result.
Does it beat grep?
The agent trials put the same assumption under pressure: following fewer steps might still produce a slower investigation.
In one recorded investigation, both approaches scored 24 of 24 points across twelve source-evidence obligations. The Graphtia workflow used 15 operations versus 17 for the text-search workflow, but took about 207.048 seconds versus 143.828 seconds, and delivered more measured wrapper output: 296,100 bytes versus 194,702 bytes.
That review was not blind, and bytes of tool wrappers are not billed model tokens. Fewer operations did not imply lower elapsed time or less context in that trial. We are not presenting it as a Graphtia efficiency win.
There were useful narrower improvements too. In another paired investigation, both answers scored 24/24 in a blind review of twelve obligations. Graphtia plus source reads delivered 292,546 bytes versus 426,405 bytes for the text-search workflow, about 31.39% less, but took 312.721 seconds versus 199.082 seconds. That was one pair of investigations, with preparation outside the measured research scope and incompletely symmetric instrumentation; it did not demonstrate lower total session cost.
An installed OpenAPI selector check reduced a particular endpoint lookup from three pages / 71,613 bytes to one request / 23,303 bytes, preserving the selected operation and schema evidence. That is a focused retrieval improvement, not a benchmark against grep, a deeper analyzer, or a universal 67% saving.
The reason to use a structural index is that it can return typed identities and source-backed relationships that would otherwise need to be reconstructed. Whether that makes a particular investigation better must be measured on the actual task. Literal lookup, an already known edit, or unsupported behavior can still call for text search and direct source inspection.
The workflow we are improving is resolve once, follow the relevant relationship, inspect its evidence, and expand only when the question requires it. A compact answer should make the next step clearer, not force twenty speculative queries.
Where the product stands
Explorer is available in public beta for Windows and Ubuntu. The Free plan includes 100,000 code LOC per workspace and two workspaces per installation. The desktop repository is private; this is not an open-source release.
The public build and the experimental indexing work above are separate. The new full-corpus Windows/Ubuntu comparison is unfinished. We have not demonstrated linear CPU scaling or performed a 512 GB run. We also have no controlled claim of identical Windows/Linux timings, and our SQL provenance remains bounded by its supported patterns.
Graphtia started from wanting a checkable way to investigate facts that coding agents could miss. We now use it on its own codebase as part of that process, alongside source review and regression tests.
The ReverseBlock investigation is the kind of progress I care about: begin with a concrete uncertainty, follow a supported relationship, and return to the code when the evidence stops. That can help a developer learning an unfamiliar system as much as an agent preparing a change. It does not require pretending that the whole system has been understood.
The download, documentation, and measurement data are available for inspection. I am interested in which relationships make an investigation easier to continue, and which unresolved boundaries still send you back to the source.